The DIY n8n Dashboard Trap: Why Your Webhook Dashboard Can't Tell You n8n Is Down
The classic n8n monitoring dashboard queries n8n's own database and renders HTML from a Webhook node. It's clever, it's free, and it has two structural flaws: nobody outside the VPN can see it, and it dies at the exact moment it has something important to say.
It usually starts with a perfectly reasonable question from the operations team: "Can we see somewhere how many orders came through today?" You're the one who built the workflows, so you do the natural thing. A Webhook node, a query against n8n's own execution table, a bit of HTML, and twenty minutes later there's a URL that renders a tidy little status page. Green rows, run counts, timestamps. You send the link around, someone says "nice", and you move on to real work.
Then someone from the sales office opens the link and gets a timeout. Then a quiet week in August passes where the dashboard confidently shows Tuesday's numbers for four days straight, because n8n itself had stopped, and the dashboard, well, runs on n8n. This post is about why the DIY n8n monitoring dashboard keeps failing the two audiences it was built for, and how to flip the architecture so the numbers reach the people who need them, without exposing your n8n instance to anything.
The classic DIY dashboard (and why everyone builds it)
The pattern is well loved in the n8n community, and honestly, it's a fun build. Your workflows already produce the numbers, n8n can already render HTML, so why not let n8n serve the dashboard itself? The whole thing is one workflow with five nodes:
- A Webhook trigger listening for GET requests. Its URL is the dashboard's address.
- A Get row(s) step that reads the run data, from a data table your workflows log into, or straight from n8n's own execution_entity table via a Postgres node.
- An Aggregate node that folds the rows into totals: runs per workflow, successes, failures, last run.
- An HTML node that turns the totals into a page, handed back through Respond to Webhook.
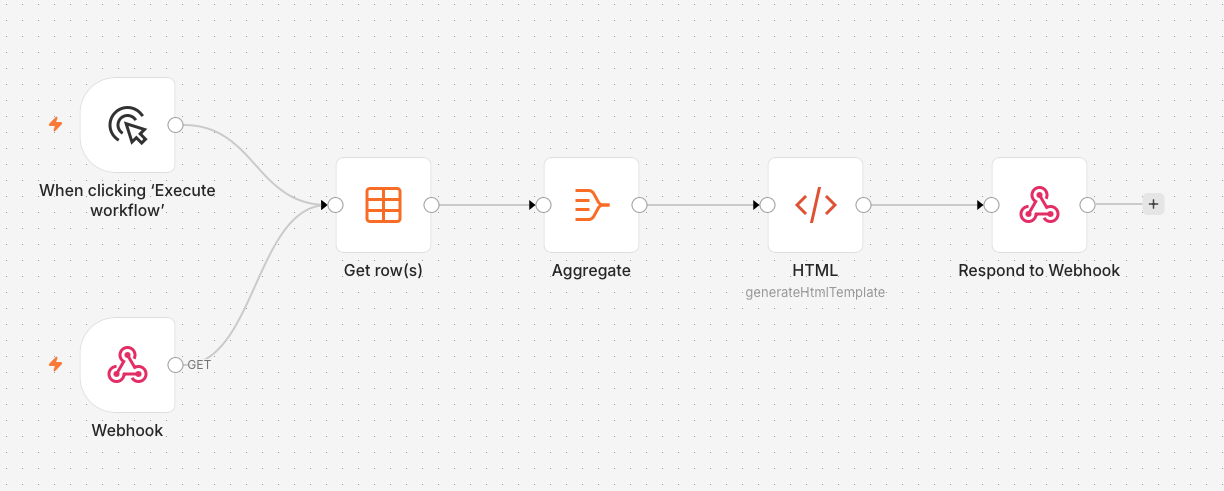
The whole DIY dashboard: Webhook (GET) → Get row(s) → Aggregate → HTML → Respond to Webhook.
Open the webhook URL in a browser and there's your status page: a table, a green or red badge per workflow, run counts, timestamps. Zero extra infrastructure, zero license cost, one URL to share. If your whole team sits on the same network as n8n and your n8n instance never has a bad day, it genuinely works. Those are two big ifs, and they're exactly where it comes apart.
Trap 1: the dashboard lives behind the same VPN as n8n
Here's the part the tutorials skip, because tutorials run on localhost. In a lot of mid-sized companies, n8n is deliberately not reachable from the internet. It runs on a server at a production site, or in a factory network segment, or on a VM that IT only exposes through a VPN tunnel. Often it isn't even on the general office intranet, because the machine network at a plant is its own isolated world. That's not an oversight. It's IT doing its job: an automation platform that holds credentials to your ERP, your mail server, and your customer data has no business having a public IP.
But your DIY dashboard is served by n8n. Same host, same port, same network rules. The webhook URL that works beautifully on your machine, inside the tunnel, is a timeout for everyone else. And the people who actually wanted the dashboard, the operations lead, the sales back office, the department that asked "did the orders come through", are precisely the people who don't have a VPN profile and never will. Getting them one means a ticket, a security review, and a conversation where you explain why the sales team needs network access to a production system. That conversation goes one way.
So the dashboard quietly degrades into you, opening the VPN, taking a screenshot, and pasting it into an email every Monday morning. The automation is automated. The reporting about the automation is you.
Trap 2: a dashboard hosted by the system it monitors can't tell you that system is down
The second flaw is worse, because it hits exactly when monitoring matters. Walk through what the DIY dashboard does when n8n itself stops: the container crashes, the VM reboots into a hung state, the scheduler silently stops firing after a redeploy, or someone deactivates the wrong workflow. The dashboard doesn't turn red. It can't. The webhook that renders it is a workflow on the very instance that just died.
Best case, the URL throws an error and someone wonders about it. Worst case, and this is the one that actually happens, a cached or half-alive instance keeps serving stale numbers. Tuesday's order count, displayed proudly on Friday. Every green badge on that page is a claim made by the defendant. This is the silent failure in its purest form: nothing errors, nothing alerts, the work just stops happening, and the person who notices first is the person the numbers were for.
The rule worth remembering: a dashboard hosted by the system it monitors can never report that system down. Monitoring has to sit outside the thing being monitored, or it inherits every failure it was supposed to catch. That's the whole argument for an external dead man's switch: don't rely on the platform to tell you the platform stopped.
Trap 3: the execution table doesn't hold your business numbers
Even on its best day, execution_entity answers a technical question: did the workflow run, and did it throw. It does not answer the question the department actually asked, which was about orders, not executions. A run that reports success after processing zero items because an API returned an empty page looks identical, in that table, to the best run of the month. And n8n prunes execution data on a schedule, so your "last 30 days" view depends on retention settings someone else controls.
The numbers a non-technical team cares about, items processed, orders synced, revenue touched, live inside the runs, and they have to be reported deliberately. That's payload inspection, and it's the difference between "it ran" and "it did the work". We've written up the full case in Beyond Uptime: tracking business metrics in your monitoring, but it matters here because the fix for trap 3 is the same move that fixes traps 1 and 2.
Invert the direction: push the numbers out, don't let people in
The DIY dashboard fails because it makes people come to n8n. The fix is to make n8n push a tiny signal out. At the end of each workflow, one node sends a heartbeat to an external monitoring service, and attaches the business numbers as custom properties. That's it. One outbound HTTPS request per run.
This inversion dissolves all three traps at once:
- No inbound access, ever. Outbound HTTPS on port 443 is allowed from virtually every locked-down network, including plant networks behind VPN. n8n stays exactly as unreachable as IT wants it. Nobody opens a port, nobody writes a firewall exception, nobody has the sales-team-VPN conversation.
- The dashboard survives n8n. It's hosted outside, so when n8n stops, the heartbeats stop arriving, the monitor goes overdue after its grace period, and the silence itself becomes the alert. A dead instance can't fake a green badge anymore.
- The numbers are the business numbers. You report itemsProcessed or sum straight from the workflow data, not whatever the execution table happens to retain.
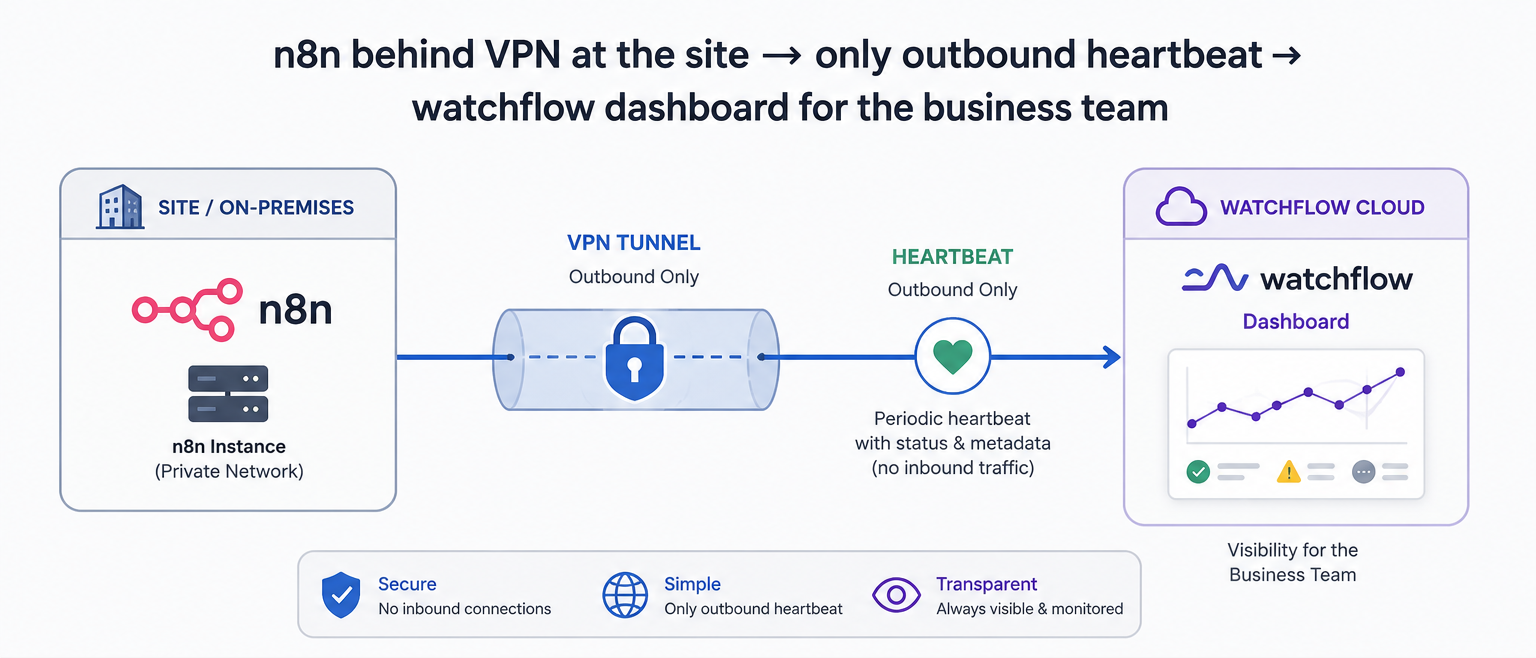
The direction flip: n8n pushes out through the firewall, the team looks at the cloud, and nobody tunnels into the plant network.
The setup in n8n: one node, a few named metrics
With the native watchflow n8n node, the whole thing is one node at the end of each workflow you care about. Select Workflow Monitoring → Report a successful run, and add your business numbers as Custom Properties. Each value is a normal n8n expression, so anything flowing through the workflow can become a metric:
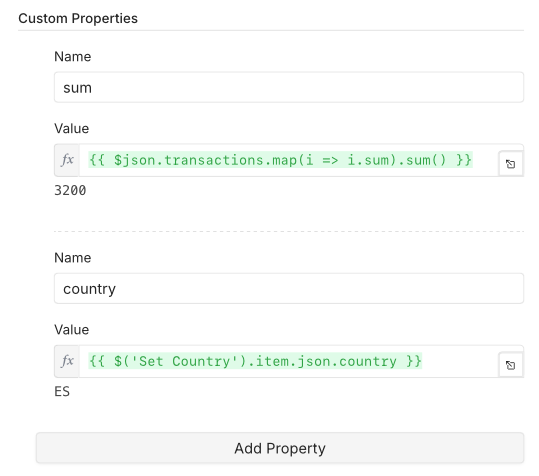
Custom Properties in the watchflow node: every value is an n8n expression, evaluated per run.
Typical properties that make a department dashboard useful:
- itemsProcessed = {{ $input.all().length }}, the universal "did it actually do work" number.
- sum = {{ $json.transactions.map(i => i.sum).sum() }}, an aggregated business value straight from the payload.
- A dimension like country or a client name, pulled from any upstream node.
Pro tip: when a property aggregates over all incoming items, like {{ $input.all().length }}, enable Execute Once in the node settings so you send one heartbeat per run instead of one per item.
No native node in your setup, or you want it from a script? The same thing is a single HTTP request against the heartbeat API:
For grace periods, adaptive intervals, and the error-workflow side of the story, the complete n8n monitoring guide walks through the full production setup.
What the department actually sees
On the watchflow side, those properties stop being invisible payload and become the dashboard you were trying to hand-build all along. Every metric reported with a heartbeat is plotted on a shared timeline next to the run frequency, so "how many, and is it still running" is one view instead of one SQL query and one prayer:
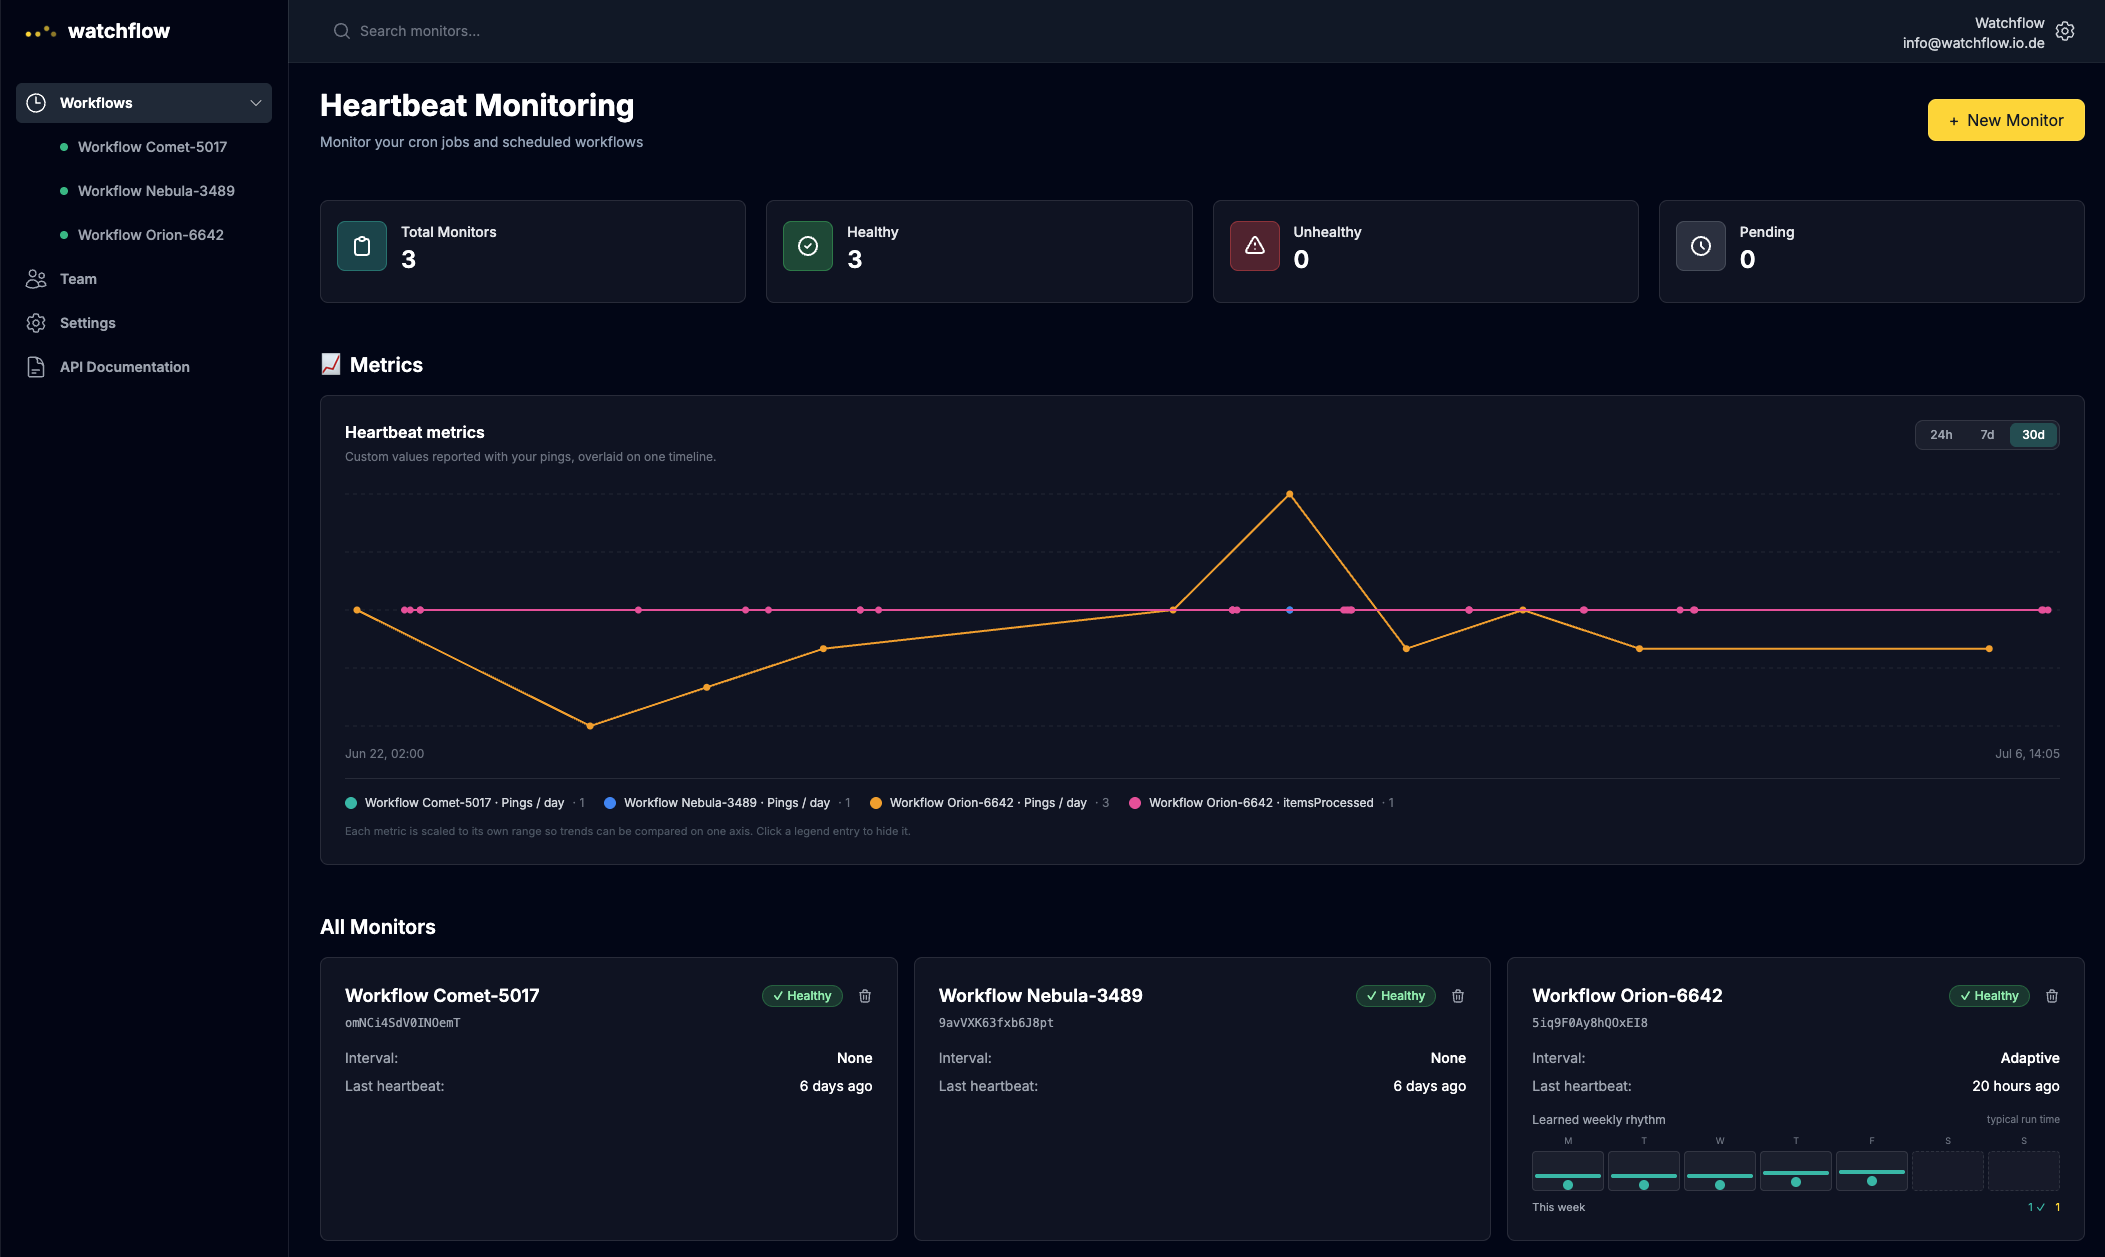
Custom metrics from the n8n node, overlaid with run activity. The Orion workflow's learned weekly rhythm shows which days a run is expected at all.
A few things about this view that the DIY version can't offer, no matter how good your HTML is:
- It's reachable from a normal browser. You invite the operations lead into the workspace like you'd invite them to any SaaS tool. Login, not VPN profile. To be clear about what this is: a workspace login for your team or client, not an anonymous public link.
- It goes loud when n8n goes quiet. The monitor learns each workflow's weekly rhythm, and a missing run on a normally-busy day turns into an alert on Slack, Teams, email, or a webhook, instead of one stale number nobody questions. Multi-channel matters here: the person who cares about Tuesday's orders is rarely the person reading a monitoring inbox.
- Zero drift, zero maintenance. There's no HTML workflow to keep updating, no query to fix after an n8n upgrade changes the schema, and no retention setting silently truncating your chart.
And an honest boundary, because this matters for trust: this is workflow observability, not a BI suite. If the department needs pivot tables and quarterly cohort analysis, that's a data warehouse job. What they asked for, though, "is it running, and how much did it do today", is exactly this, and it's the version of the answer that stays correct even when n8n itself is the thing that broke. If you're running self-hosted n8n behind a firewall, this outbound-only model is the difference between monitoring you have and monitoring you demo.
Conclusion
The DIY webhook dashboard is a great weekend build with two structural problems it cannot outgrow: it lives behind the same wall as n8n, so the people it was made for can't reach it, and it's hosted by the system it's supposed to watch, so it goes down, or worse, goes stale, at exactly the wrong moment. Flip the direction. Let every workflow push one heartbeat with its business numbers out through the firewall, and give the department a dashboard that lives outside the blast radius. The plant network stays sealed, IT stays happy, and the first sign of trouble is an alert to you, not a question from the people reading the numbers.
Ship the automation. We'll watch it.
Protect your most critical workflow free, forever: 3 heartbeats, silent-failure alerts, custom metrics, and the native n8n node. No credit card.