n8n Workflow Monitoring:
Never Miss a Silent Failure Again
n8n workflows—whether self-hosted or cloud—are powerful automation engines that can transform your business operations. But there's a hidden danger: workflows can fail silently. Your automation might stop running, process zero records, or hang indefinitely—and you won't know until it's too late.
Traditional monitoring approaches like error logs or internal alerts often fail when you need them most. External monitoring ensures you're alerted even when your infrastructure goes down.
watchflow provides external n8n monitoring with Dead Man's Switch reliability—ensuring you're alerted the moment your critical workflows stop delivering results.
Why n8n Workflows Need External Monitoring
When you self-host n8n, you gain complete control over your automation infrastructure. But with that control comes responsibility for reliability. Internal monitoring solutions have a critical flaw: they fail when your infrastructure fails.
Learn more about monitoring self-hosted n8n workflows and discover how to monitor SSL certificates for your automation infrastructure.
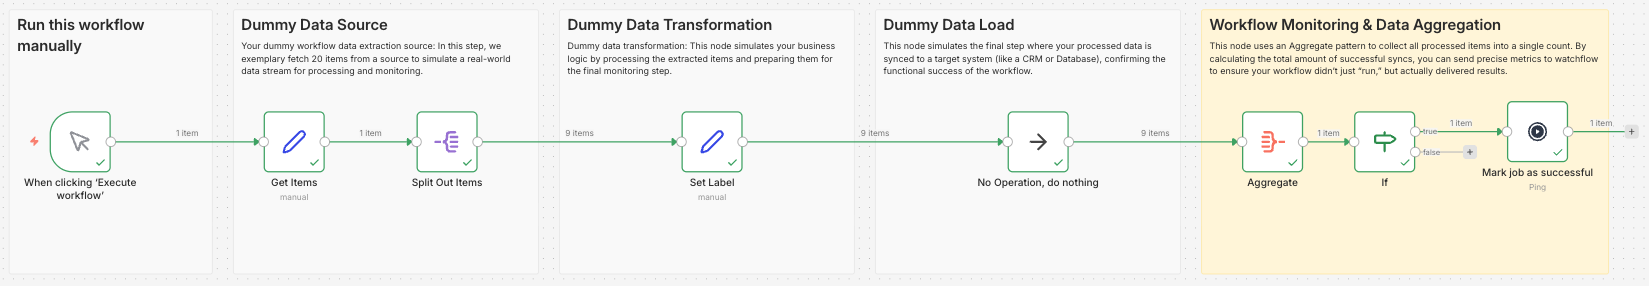
Production-ready n8n workflow template with integrated watchflow monitoring
Common Failure Modes
Silent Workflow Failures
Cron triggers stop firing, queue workers die, or database connections fail. From the outside, nothing happened—but your critical business process just stopped.
Zero-Result Success
The workflow executes successfully but processes 0 records, syncs 0 customers, or skips critical branches due to unexpected data. It "worked"—but delivered nothing.
Infrastructure Blind Spots
Disk space exhaustion, memory leaks, network partitions, or container restarts can silently kill workflows without triggering error handlers.
Monitoring Best Practices
Dead Man's Switch
Monitor that workflows run on schedule. Get alerted when expected heartbeats don't arrive—catches the most dangerous failure mode: nothing happening at all.
Performance Transparency
Track items processed, execution duration, and error rates. Detect "successful" runs that processed zero data before customers complain.
Instant Alerts
Receive immediate notifications with error details and direct links to failed executions. Fast detection means fast recovery.
How to Set Up n8n Workflow Monitoring (Step-by-Step)
This guide shows you how to implement production-grade monitoring for your n8n workflows using the watchflow template. You'll learn how to track workflow success, monitor performance metrics, and catch silent failures.
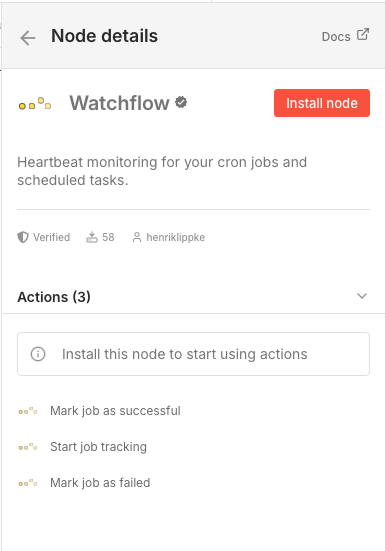
Step 1: Install the watchflow n8n Node
Install the official watchflow node directly in your n8n instance:
- Go to Settings → Community Nodes
- Click Install
- Search for "watchflow" or enter the full package name:
@watchflow/n8n-nodes-watchflow - Click Install and wait for the installation to complete
The watchflow node will then be available in your node palette and ready to use in your workflows.
Step 2: Set Up Your Workflow Structure
A monitored n8n workflow follows this pattern:
- Trigger: Your workflow trigger (Schedule, Webhook, etc.)
- Data Extraction: Fetch data from your source system
- Data Transformation: Process and transform the data
- Data Load: Sync to your target system
- Aggregate Metrics: Collect performance data
- Success Monitoring: Report success to watchflow
- Error Monitoring: Report failures to watchflow
Step 3: Add Success Monitoring
After your workflow completes successfully, aggregate the results and send them to watchflow. This creates a Dead Man's Switch that alerts you if the workflow stops running.
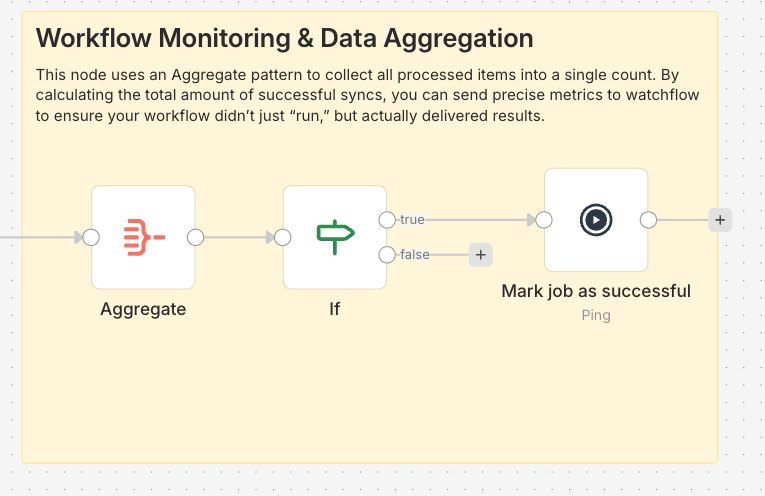
Aggregate Node Configuration
Use the Aggregate node to collect all processed items into a single count:
- Operation: Aggregate All Item Data
- Purpose: Calculate total successful operations
Conditional Check (Optional but Recommended)
Add an IF node to verify you processed at least one item:
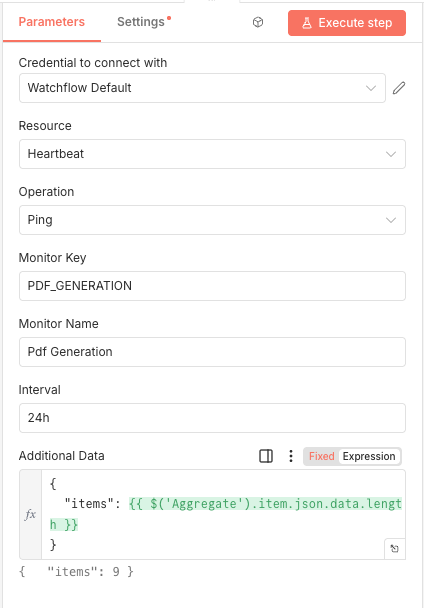
watchflow Success Node
Configure the watchflow node to mark the job as successful:
- Operation: Mark Job as Successful
- Key:
PDF_GENERATION(or your workflow identifier) - Name:
Pdf Generation(human-readable name) - Data: Send performance metrics
Example: Success monitoring with heartbeat tracking
Step 4: Add Error Monitoring
Add an Error Trigger node to catch any unexpected failures across your entire workflow. This ensures you're notified immediately when something goes wrong.
Error Trigger Configuration
- Node Type: Error Trigger
- Purpose: Catch all workflow errors
- Scope: Entire workflow
watchflow Failure Node
Configure the watchflow node to report failures:
- Operation: Mark Job as Failed
- Key:
PDF_GENERATION(same as success node) - Name:
Pdf Generation - Error: Full execution details for debugging
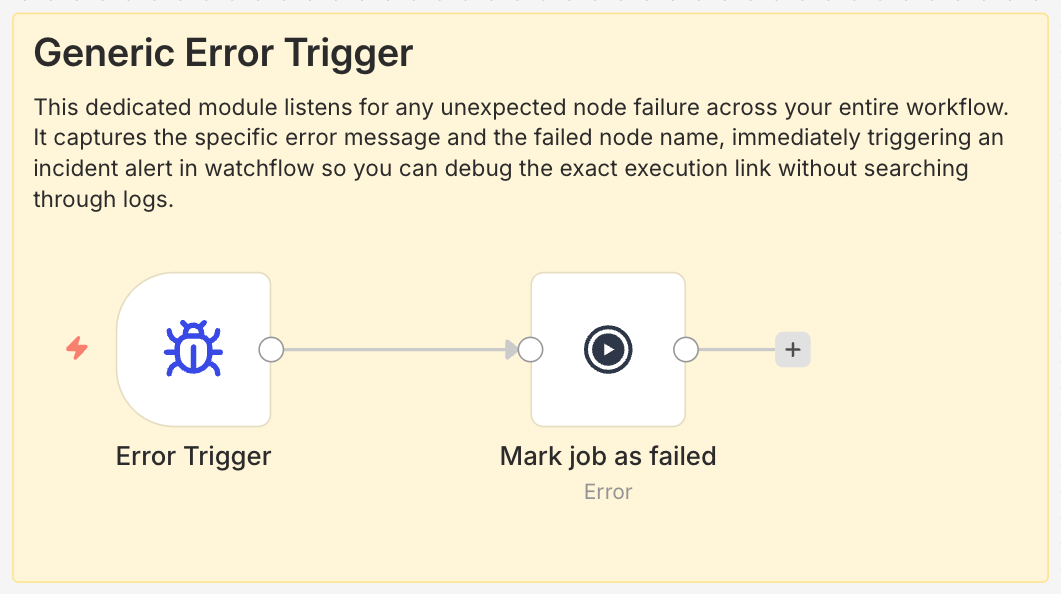
Example: Error trigger configuration for instant alerts
Step 5: Configure Your watchflow Monitor
In your watchflow dashboard, configure the monitoring parameters:
- Expected Interval: How often should the workflow run? (e.g., every 15 minutes, daily at 1 AM)
- Grace Period: Extra time to allow for retries, slow APIs, or queue backlogs (e.g., 5-30 minutes)
- Alert Threshold: Minimum items processed to consider the run successful (e.g., at least 1 item)
- Notification Channels: Email, Slack, PagerDuty, or webhook
Real-World n8n Monitoring Use Cases
Here are proven monitoring patterns for common n8n workflow scenarios:
E-commerce Order Sync
Scenario: Sync orders from Shopify to your ERP every 15 minutes
- Interval: 15 minutes
- Grace Period: 5 minutes
- Monitor: Orders synced count
- Alert: If 0 orders for 2 hours (potential API issue)
Nightly Data Export
Scenario: Export customer data to S3 every night at 1 AM
- Interval: 24 hours
- Grace Period: 30 minutes
- Monitor: Customers exported, file size
- Alert: If export doesn't complete by 2 AM
Real-Time Lead Routing
Scenario: Route inbound leads to sales reps via webhook
- Interval: 5 minutes (expected activity)
- Grace Period: 2 minutes
- Monitor: Leads routed per hour
- Alert: If no leads for 1 hour during business hours
PDF Generation Pipeline
Scenario: Generate invoices and send to customers
- Interval: 1 hour
- Grace Period: 10 minutes
- Monitor: PDFs generated, emails sent
- Alert: If generation fails or 0 PDFs created
Start Monitoring Your n8n Workflows Today
Don't wait for a silent failure to impact your business. Set up external monitoring in minutes and sleep better knowing your critical workflows are being watched.
Frequently Asked Questions
How does watchflow differ from n8n's built-in error workflows?
n8n's error workflows are internal to your n8n instance. If your server crashes, runs out of disk space, or the database locks up, those error workflows won't run. watchflow provides external monitoring—a Dead Man's Switch that alerts you when expected heartbeats don't arrive, regardless of your infrastructure state.
Can I monitor workflows that run on n8n Cloud?
Yes! watchflow works with both self-hosted n8n and n8n Cloud. The monitoring pattern is the same—add the watchflow node to your workflow and configure your monitoring parameters.
What happens if my workflow processes 0 items legitimately?
You can configure conditional logic in your workflow to only send success pings when items are processed. Alternatively, set up different alert thresholds in watchflow for different times of day or days of the week.
How do I avoid alert fatigue with transient errors?
Use the Grace Period setting to allow time for retries and transient issues to resolve. Only alert when a workflow is truly overdue (interval + grace period), not on every individual node error.
Can I monitor multiple n8n instances?
Absolutely. Each workflow gets a unique monitoring key, and you can track workflows across multiple n8n instances, environments (dev/staging/prod), or even different automation platforms (n8n + Make.com).