n8n Schedule Trigger Not Firing? Why It Stopped Silently, and How to Catch It Next Time
A Schedule Trigger can stop firing with no error, no failed execution, and no log entry, because a run that never starts can't fail. Here's why your error workflow is blind to it, and how to get alerted the moment a run goes missing instead of hearing it from your client.
It's a little after 2 AM when the message comes in. "Hey, are the leads still syncing? We haven't seen anything come through since Tuesday." You open n8n half-asleep, expecting a wall of red. There isn't one. The workflow is active. You hit Execute Workflow and it runs perfectly, pulls the records, syncs them, finishes green. Everything works. So you scroll to the execution list to see what happened on Tuesday, and that's when it sinks in: the only recent entry is the manual run you just triggered. The scheduler didn't fail on Tuesday. It simply never tried to run.
If you've ever Googled "n8n workflow stopped running" at an hour like that, you already know the worst part. It isn't that something broke. Things break, that's expected, you build for it. The worst part is that nothing told you. No alert, no email, no failed execution to react to. The automation went quiet and the silence looked exactly like success, right up until a human noticed the absence of work and asked about it. This post is about why that happens, and how to make sure the next missed run reaches you before it reaches your client.
Why your n8n schedule trigger stops firing
Let's get the troubleshooting out of the way first, because if your n8n schedule trigger is not firing right now, you want causes, not philosophy. The usual suspects are short:
- The workflow isn't actually active. The most common one, and the most embarrassing. A workflow was edited, saved, and the Active toggle never went back on, or an import/duplicate left the copy inactive. Schedule triggers only fire for active workflows.
- Timezone drift. The Schedule Trigger evaluates in the instance timezone (or the workflow's own setting). If your server runs UTC and you think in local time, "every day at 09:00" fires at a time you're not watching, and a DST shift can move it by an hour or skip it entirely.
- A scheduler hang after redeploy or in queue mode. On self-hosted instances, the internal cron registers when the main process boots. After a restart, a redeploy, or in queue mode where the main and worker processes get out of sync, the trigger sometimes just doesn't re-register. The workflow looks active; nothing is scheduled.
- Cloud instance restarts and sleeps. Managed and container hosts cycle. If the process restarts mid-interval, the next tick can be skipped, and on instances that idle down, a schedule that should have fired during the quiet window never does.
- A second instance, or a stale one. A migrated or cloned environment where an old instance still holds the "active" workflow, or two instances both think they own the schedule, leads to runs landing somewhere you're not looking, or cancelling each other out.
Work down that list and you'll usually find the cause. But even when you do, you've only answered the small question. The real one is still sitting there: why did you find out from your client, and not from your monitoring?
Why your error workflow won't catch this
This is the part that catches out the people who think they've already solved monitoring. You set up an Error Trigger workflow ages ago. It posts to Slack on every failure. You've seen it work. So how did a dead schedule slip past it?
Because the Error Trigger is structurally blind to a missed run. Walk the chain of cause and effect. The Error Trigger fires when an execution fails. An execution fails when a workflow runs and something inside it throws. But if the scheduler never fired, there is no execution. And if there is no execution, there is nothing to fail. And if nothing fails, the Error Trigger has nothing to react to. It's not misconfigured, it's working exactly as designed, the design just has nothing to bite on.
The distinction that matters: error handling catches failed runs. It cannot catch absent runs. A run that errors leaves a trace to alert on. A run that never starts leaves nothing, and "nothing" is precisely what every error-based system treats as healthy.
This is the same blind spot that turns cron jobs into silent failures, and it's why an instance can "look fine" while a self-hosted n8n workflow has quietly stopped. Most people only understand the difference between a failed run and a missed run after their first silent outage. You're getting it for free.
The fix is external: heartbeat monitoring
If the platform can't tell you when it stopped, something outside the platform has to. That's the whole idea behind heartbeat monitoring, and it inverts the logic that just failed you. Instead of waiting for n8n to report a problem, your workflow sends a small heartbeat every time it completes a run. An independent service expects that heartbeat on a schedule. When the heartbeat doesn't arrive, the absence itself is the alert.
You'll see this pattern called a dead man's switch: a signal that has to keep arriving to keep the alarm quiet, so that going silent is what trips it. It's a good mental model, and it's worth being honest about where it fits. For a machine-paced cronjob that runs every 15 minutes forever, the dead man's switch is a perfect description, a steady pulse, and a flatline means trouble. For the business-driven workflows most consultants actually run, the picture is only half right. A lead sync that runs on weekdays should go silent on Sunday. That's not a flatline, that's a weekend. Hold onto that gap, because it's exactly where the naive version of this falls apart.
Why a fixed-interval check still pages you at 3 AM
Here's the honest admission that most monitoring pitches skip. The classic heartbeat check, the healthchecks.io style, asks you to hardcode one number: the interval. You tell it "expect a ping every 24 hours," and it alerts when 24 hours (plus a grace period) pass with no ping. For a job that genuinely runs every 24 hours, flawless. For a real business workflow, it starts fighting you almost immediately.
Your lead sync runs Monday through Friday. It legitimately doesn't run on Sundays. One Thursday it's a public holiday and the upstream system is closed, so it correctly does nothing. A fixed-interval monitor doesn't know any of that. It just knows a ping was due and didn't come, so it pages you Sunday morning for a workflow that is behaving perfectly. After two or three of those, you do the rational thing and the dangerous thing at once: you stretch the grace period out to three days so the weekend stops triggering it.
And now you've quietly defeated the entire point. A monitor with a three-day grace period takes three days to notice a real outage. You widened the window to silence the false alarms, and in doing so you blinded yourself to the true ones. The fixed interval forces a losing trade: tolerate noise, or tolerate slow detection. Pick one.
Monitoring that learns the rhythm instead
The way out is to stop hardcoding the schedule and let the monitor learn it. The principle is simple, and it's the principle that matters far more than any single parameter: a monitor that watches its own history already knows roughly when your workflow tends to run.
From the heartbeats it has already received, it learns which days of the week a workflow normally runs, and roughly when. A day that's normally quiet stays quiet without paging you, Sunday is expected-silent, so silence on Sunday means nothing. But on a day the workflow normally runs, if the usual time comes and goes with no heartbeat (plus a short grace for the inevitable jitter), that is a missed run, and that's when you get paged.
No cron strings to transcribe. No timezone field to get wrong. No grace period to agonize over and inevitably set too wide. You point the workflow at the monitor, let it run for a while, and the expectation shapes itself around the workflow's actual behavior. The weekend stops being a false alarm and a genuinely missed Tuesday stops being a three-day blind spot, at the same time, without you tuning anything. That's the difference between a monitor you fight and a monitor that just tells you when a run goes missing.
"It says success, but did it actually do anything?"
There's a second species of silent failure worth naming, because it hides even from a perfect missed-run detector. The workflow fires on schedule. It runs to the end. It reports success, green the whole way. And it processed 0 records, because the API returned an empty page, a filter silently matched nothing, or a credential expired into a valid-but-empty response.
A bare status can't catch that, "ran" and "did the work" are different claims. The fix is to send a little payload with the heartbeat, the numbers you actually care about, like itemsProcessed or recordsSynced, so a "successful" run that did nothing still raises a flag. That's the whole argument of tracking business metrics instead of uptime: a heartbeat proves it ran, the payload proves it worked.
Setting it up in n8n (2 nodes)
The practical payoff is smaller than the problem makes it sound. With watchflow's native n8n node, full coverage is two pieces, and neither one asks you to guess an interval or hand-build a webhook.
1. One Global Error Trigger workflow (the failed-run path)
Create a single workflow with n8n's native Error Trigger and connect it to a watchflow Report a failed run node. Set it as your instance's error workflow once, and every workflow that throws reports its failure automatically, no per-workflow wiring. This is your loud, fast path for runs that do start and break.
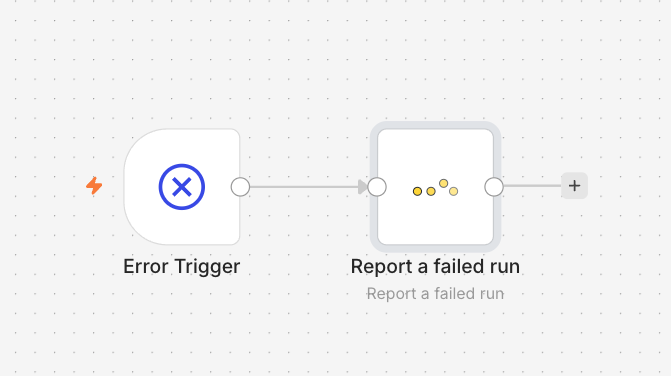
One Error Trigger workflow → one watchflow "Report a failed run" node, set as the instance error workflow.
2. A "Report a successful run" node at the end of each workflow (the missed-run path)
Drop a Report a successful run node as the last step of any workflow you care about. It fires the heartbeat that proves the run actually finished, so watchflow can alert you when the next one doesn't arrive, even though n8n never threw an error. This is the node that closes the exact gap we started with.
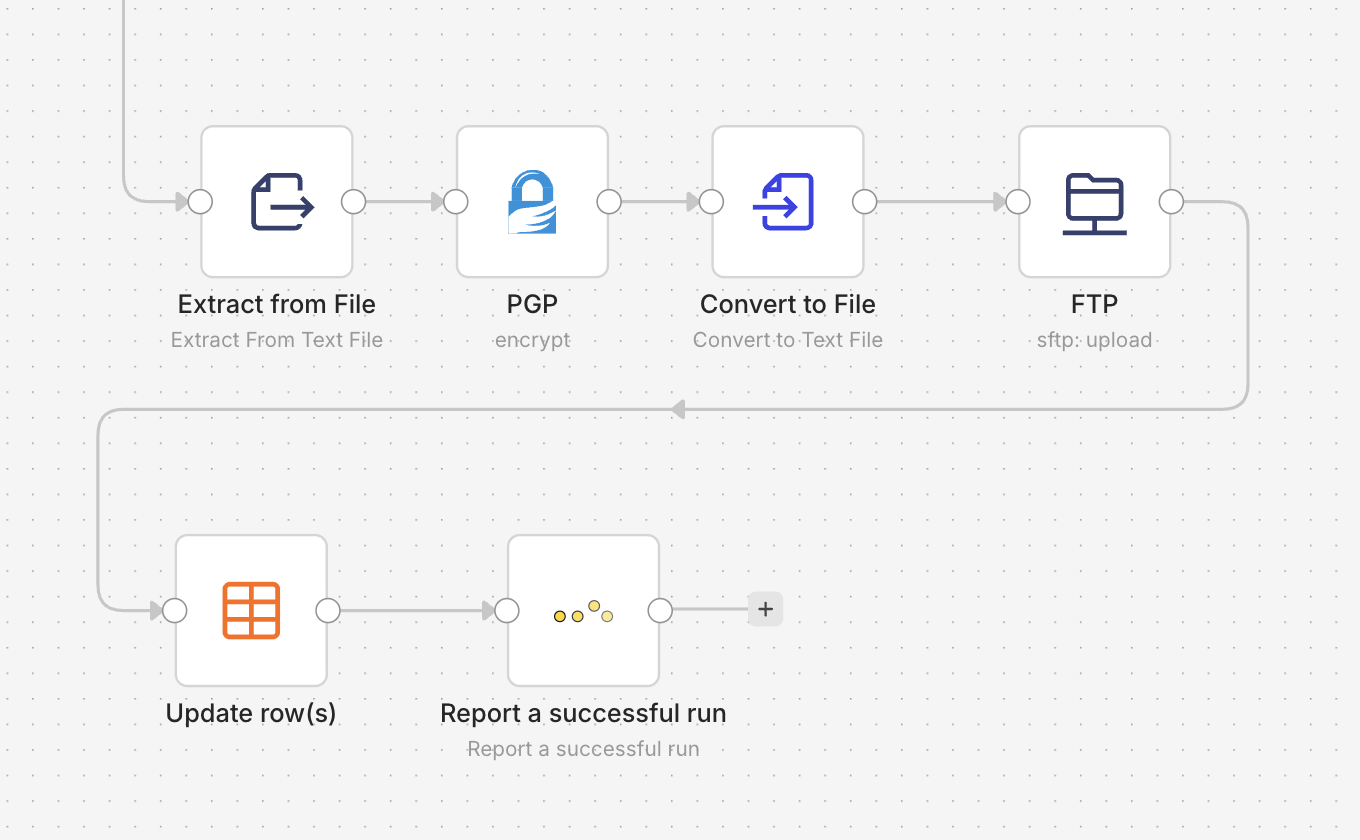
A "Report a successful run" node as the final step, the heartbeat whose absence becomes the alert.
Configuration is almost nothing: pick your credential, leave Workflow Monitoring selected, done. Want richer monitors? Add optional Custom Properties like itemsProcessed = {{ $input.all().length }} and they show up right on the monitor for the payload check from the previous section.
Pro tip: when a property reads all incoming items, like {{ $input.all().length }}, turn on Execute Once in the node settings so it sends a single heartbeat per run instead of one per item.
Prefer the raw call, or not on the native node yet? Any HTTP Request node works too:
For the full walkthrough with the Aggregate node, conditional checks, and production templates, see the complete n8n setup guide. And if you're weighing schedule triggers against webhooks or event-driven runs in the first place, each approach fails in its own way, and all three benefit from the same external safety net.
Conclusion
A dead schedule trigger isn't the real failure. Finding out about it from your client is. Your error workflow was never going to catch it, because a run that never starts can't throw an error, and a fixed-interval check either nags you every weekend or takes three days to notice a genuine outage. A monitor that learns your workflow's rhythm closes both gaps at once: it stays quiet when silence is expected and pages you the moment a normally-busy day goes quiet.
Hear it from your monitor first, not from your client.
Protect your most critical workflow free, forever, 3 heartbeats, missed-run and silent-failure alerts, and the native n8n node. No credit card.